Dependency Structure Matrix
How isolated and modular is the code? Can I pickup one area without understanding and knowing the rest of the system?
You’ll often hear software pundits preach about the importance of high cohesion and low coupling of code - but what exactly does that mean and why is it important?
Fast forward to holiday season. You’re tasked with making the dinner for the entire family - a 3 hour sit down event. You’ve planned out the meal to include a salad, a main course, a dessert, and start off with appetizers.
{ed: Like the concept but this made me think of summer holidays, we need to find a less American intro to the idea}
You’ve got discrete dishes that you want to taste fantastic on their own, but you also don’t want to have one course negatively affect the other. Having a dish stand on it’s own is like having high cohesion in your code. Not having one course affect another is like having low coupling. The best meal you can make works at an invidiual course (i.e. cohesion) and across the whole dinning experience (i.e. coupling).
If you’re code follows this principal it becomes a lot easier to understand and extend. Back to the analogy, you can have separate cooks prepare different courses.
So how do you know if you’re code is high in cohesion and low in coupling? The dependency structure matrix can show you this as well and more.
What You’ll See
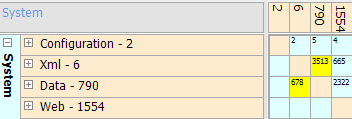
It’s a matrix with two axes - packages/namespaces along both. The columns, components across the x-axis, represent outgoing dependencies, while the rows, coponents across the y-axis, show incoming dependencies. The numbers in the boxes refer to the number of times that the dependency occurs, from the component shown at the top to the component shown on the left.
References within components are highlighted as a shaded area of orange. When you see a package depend have a high numbers in the rows within itself that indicates good cohesion.
When you see a small number of dependencies outside of that package (i.e. outside the orange zone) that suggests a low coupling.
{ed: confused, which orange zones?}
Additionally, as the systems get larger with more and more classes and modules to visualise it’s useful to highlight high numbers so that patterns, such as coupling within a component, or rows and columns of dependencies outside a component, become easier to spot.
Example: Spring.NET
You are a developer on Spring.NET and your team is looking at how to increase the speed of development. You’ve just come back from a conference and you’ve got a few new recruits whom are all ready to join the team. The problem is where to assign them?
The team decides to take a look at where these new team members can make the biggest impact, without having to understand the whole system. To help them in this, the team generates a dependency structure matrix. The matrix shows areas that have high cohension and low coupling. This helps in a couple of ways.
First, it shows areas that are fairly well designed and don’t affect other systems in the code. This allows new developers to be immersed in a section of the code that is probably well designed, and it minimises the need to understand code outside that eare. Second, because the team has a baseline of a what the code looks like before these new team members join - they can re-run the dependency matrix again in a few weeks to make sure they’re maintaing the high cohension and low coupling of those areas.
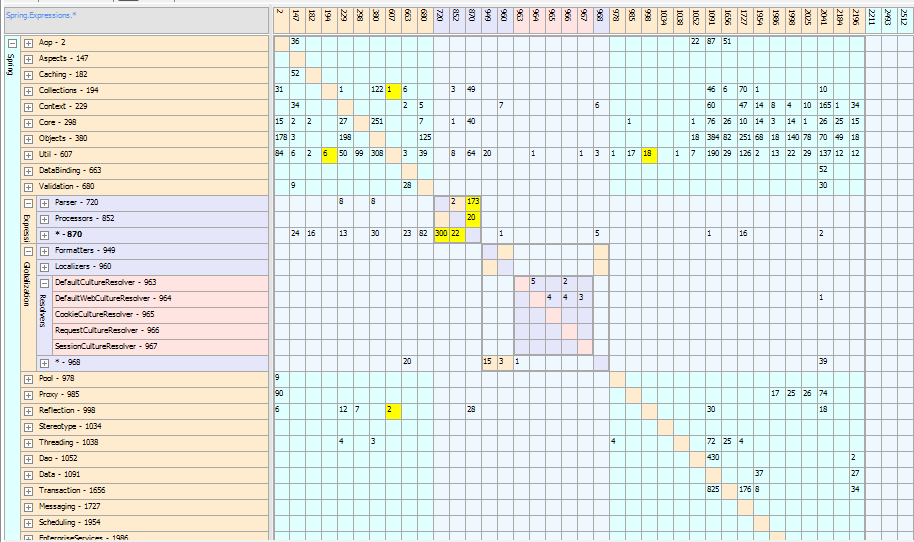
Overall it seems like Spring.NET has some clear problem areas where dependecies are concerned. Highlighted in yellow are the cyclical dependencies which cause serious problems from an isolation/modularity perspective. There are, however, some areas where we can direct our new team mates too and some areas we can clearly get them to avoid.
Looking at the Globalization package there seems to be a fairly high cohension between the different classes within the package. This would be a good candidate for our new team members because it’s only referenced by the Web and Databinding packages, lessening the impact of any changes.
Conversely, the Experessions package has both cylcical dependencies (i.e. poor cohesion) as well as broadly being used by most of the other packages (i.e. high coupling). This area is something the new team members should best avoid and the existing team should focus efforts on cleaning this up.
How It Works
{ed: do we need this section here? moved previous content to impl notes}
Variations
As the systems get larger with more and more classes and modules to visualise the actual numbers become less important and it is common to replace numbers at the intersections with dots, each dot signifying one or more dependencies. At this “zoomed out” level the focus is on spotting patterns, such as cohesion inside components and coupling outside.
In addition it can make sense to rearrange classes, grouping them not by their component/namespace/package but keeping classes that exhibit high cohesion close together. This is especially useful in systems where classes are grouped by functional type, e.g. controller, model, repository, rather than by domain. Imagine the coupling and cohesion of a controller package in a standard web application; the controllers hopefully not having any dependencies on each other (low cohesion) but many dependencies to hopefully localised parts of the model (high coupling).
Example: Spring
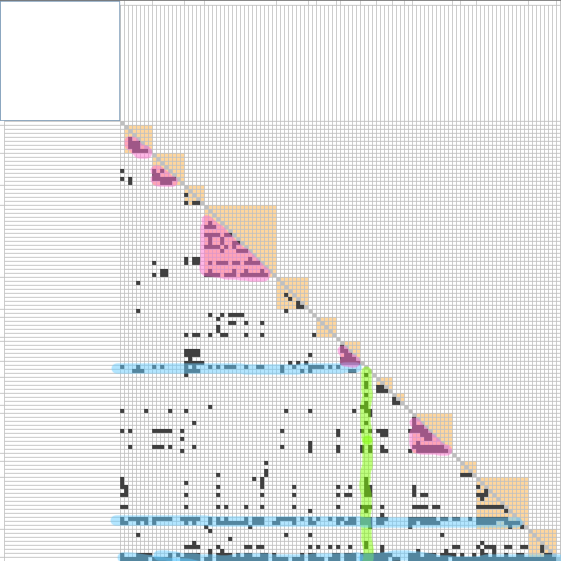
The DSM shows cohesive components in orange squares. The image has been post-processed in a drawing app to highlight areas of high cohesion in pink. It is clearly visible that the coupling outside the components is limited, even though there a some classes with higher coupling that appear as relatively solid lines, horizontal and vertical. They have been coloured blue and green in the image.
Such lines are often a problem. A row filled with dots signifies a component that many other components depend on. This can be acceptable, as in the util package in the Spring matrix above, but often it is a sign of a lack of cohesion. Conversely, a column filled with dots represents a component that depends on many other components, which is usually a sign of bad coupling and the possible presence of god classes and feature envy.
SideBar - DSM Elsewhere
Dependency structure matricies are commonly used in other fields. They can be used organizationally to help understand interactions between people, teams, and departments as well as to help map out processes such as for project management. (footnote: http://www.dsmweb.org/dsmweb/en/understand-dsm/technical-dsm-tutorial0/different-dsm-types.html for more detail).
Implementation Notes
When you gather your data for building a dependency structure matrix most of the time you’ll rely on a tool to do this for you. However, it’s important to understand what is happening under the hood.
If you were to mannually collect the information you’d need to start working through each class and count the number of references to other classes. You’ll need to keep a tally for the total number of times a specific class is referenced. Repeating this across the entire codebase will give you all the dependencies to build your matrix. Thankfully we have tools to do this for us, saving a lot of time in the data gathering.
Possible Tools:
| Langauge | Tools |
|---|---|
| .NET | Reflector + Tcdev Dsm plugin, NDepend |
| Java | dtangler, IntelliJ |
Requirements: latest version of source code
Let’s review how we pulled the depedency structure matrix for Spring .NET. Since it’s a .net code base we’ll use Reflector (footnote: http://www.reflector.net). Reflector is no longer free, but you can get a 30-day trial.
Next, we’ll need the free plug-in to generate our graph from Tom Carter (footnote: http://tcdev.free.fr/). Once it’s donwloaded and unziped the plug-in you can fire up Reflector and then under “Tools” and “Add-Ins” select the Tcdev.DsmPlugin.dll file from the plug-in.
Finally under “Tools” select “Dependency Structure Matrix” and select the namespaces you’d like to compare. Once the image is generated you can use a screen shot tool, like Windows 7’s Snipping Tool, to grab the matrix.
To add another level of detail to the matrix you can import the image into a photo editing program like photoshop to highlight areas of high-coupling and low cohension so it’s easier for people to see where there are problems.